


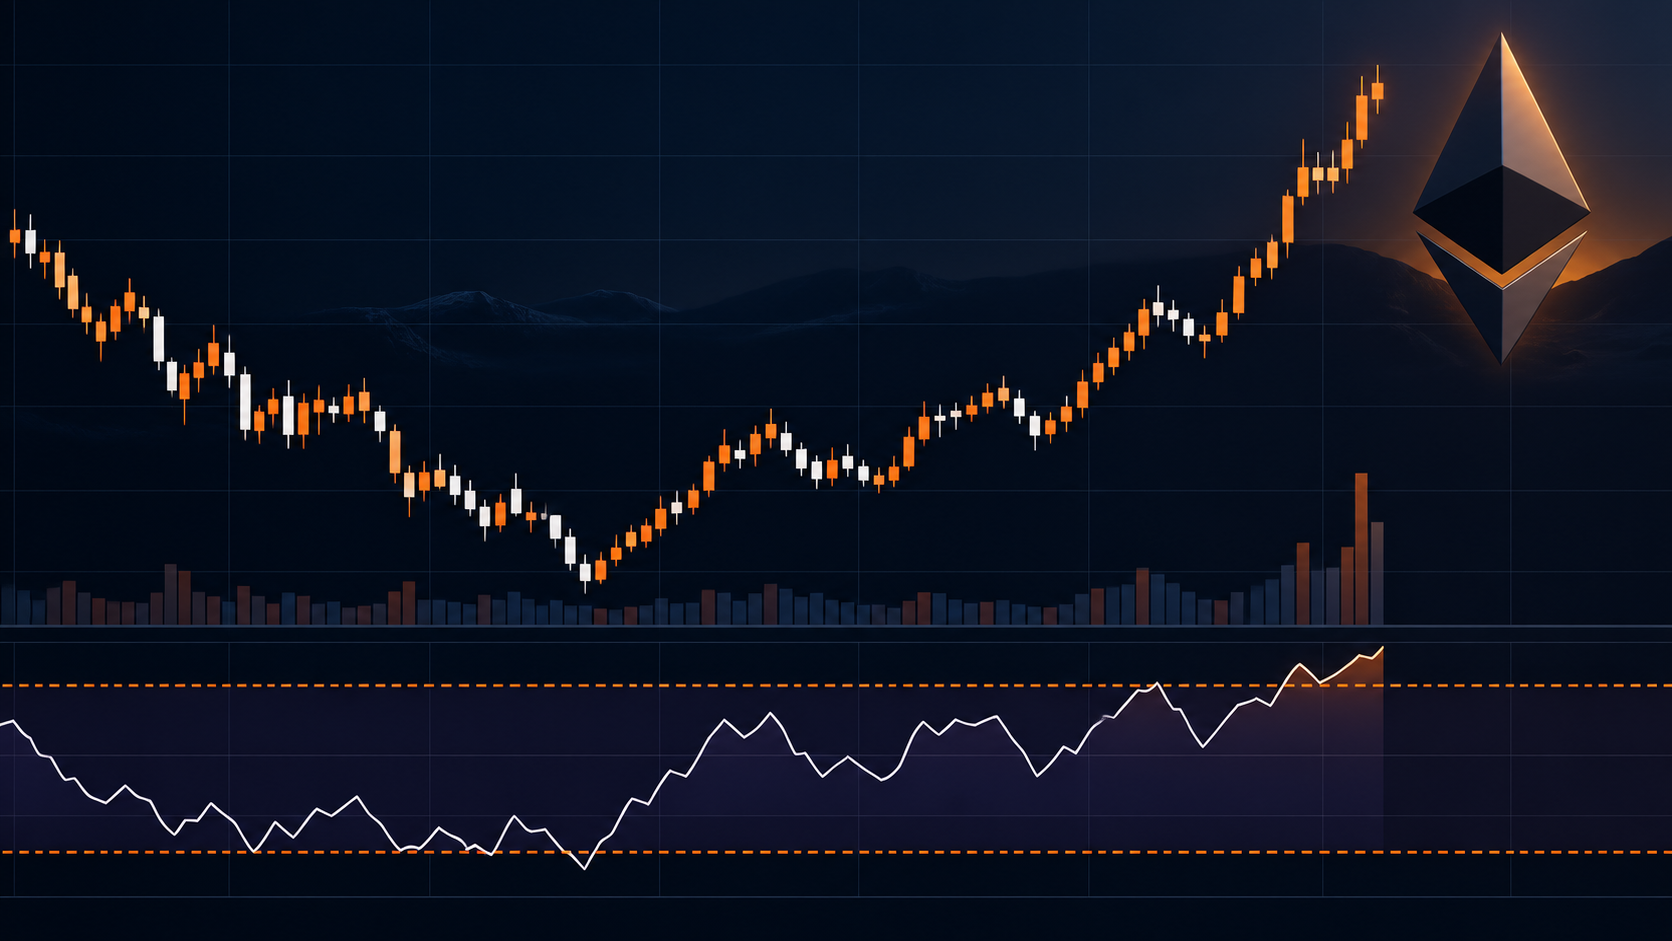
What Is RSI (Relative Strength Index)? A Guide to Overbought and Oversold Levels
What is the RSI indicator, how is it calculated, and what do the 70 and 30 levels mean? A step-by-step guide to overbought and oversold signals.
Market insights, financial education, and perspectives from TraderLex.
What is the RSI indicator, how is it calculated, and what do the 70 and 30 levels mean? A step-by-step guide to overbought and oversold signals.

What is Fibonacci retracement, what do the 0.382, 0.5, 0.618 and 0.786 levels mean, and how do you draw it correctly? A practical guide, including how it pairs

When will Bitcoin go up? We explain the halving cycle, Fed policy, risk appetite, and technical structure, and how to actually ask this question correctly.

What affects gold prices? We explain interest rates, the dollar index, central bank buying, and how gram gold relates to the exchange rate.

How do you invest in US stocks? We explain it through familiar BIST comparisons, access methods, and what to watch out for.
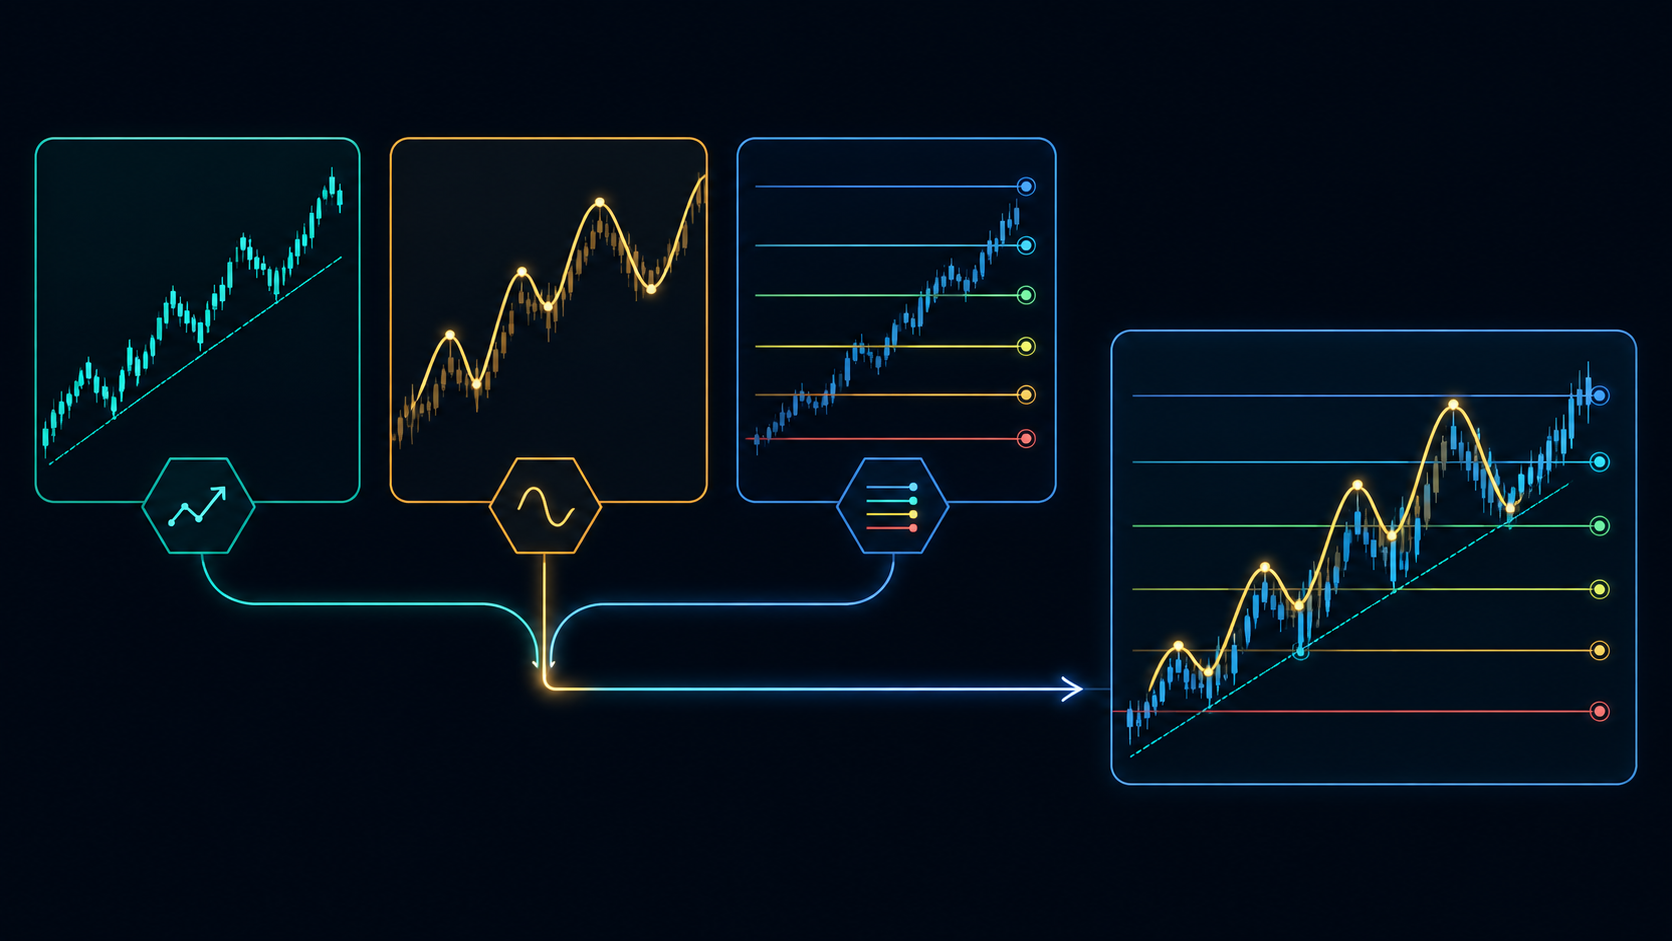
Technical analysis isn't one method. We explain how trend structure, Elliott wave and Fibonacci levels work together, with real examples.

What is risk management in trading? We explain the risk-reward ratio, stop-loss and position sizing — and why protecting capital comes before profit.

How do Fed rate decisions move the markets? We explain the chain linking rates, the dollar, gold and Bitcoin — and what traders should watch.

How to choose the best trading analysis platform in 2026: criteria on technical analysis, multi-market coverage, transparency and risk.