


İçerik (EN)
What Is RSI (Relative Strength Index)? A Guide to Overbought and Oversold Levels
RSI (Relative Strength Index) is a momentum indicator that measures whether an asset has been overbought or oversold based on recent price movement. Developed by J. Welles Wilder in 1978, RSI produces a value between 0 and 100, and its simplicity has made it one of the most widely used indicators in technical analysis.
In short, RSI answers the question "how fast and how strongly has price moved recently?" — it measures speed and strength, not direction.
How Is RSI Calculated?
RSI is typically calculated using a 14-period average gain-to-loss ratio (the period can be days, hours, or any timeframe you choose):
RSI = 100 − [100 / (1 + RS)]
Here, RS (Relative Strength) is the average gain divided by the average loss over the chosen period. You don't need to memorize the formula — nearly every charting platform (TradingView, MetaTrader, etc.) plots RSI automatically. What matters is understanding what the resulting number means.
What Do the 70 and 30 Levels Mean?
The two threshold levels most commonly referenced when interpreting RSI are:
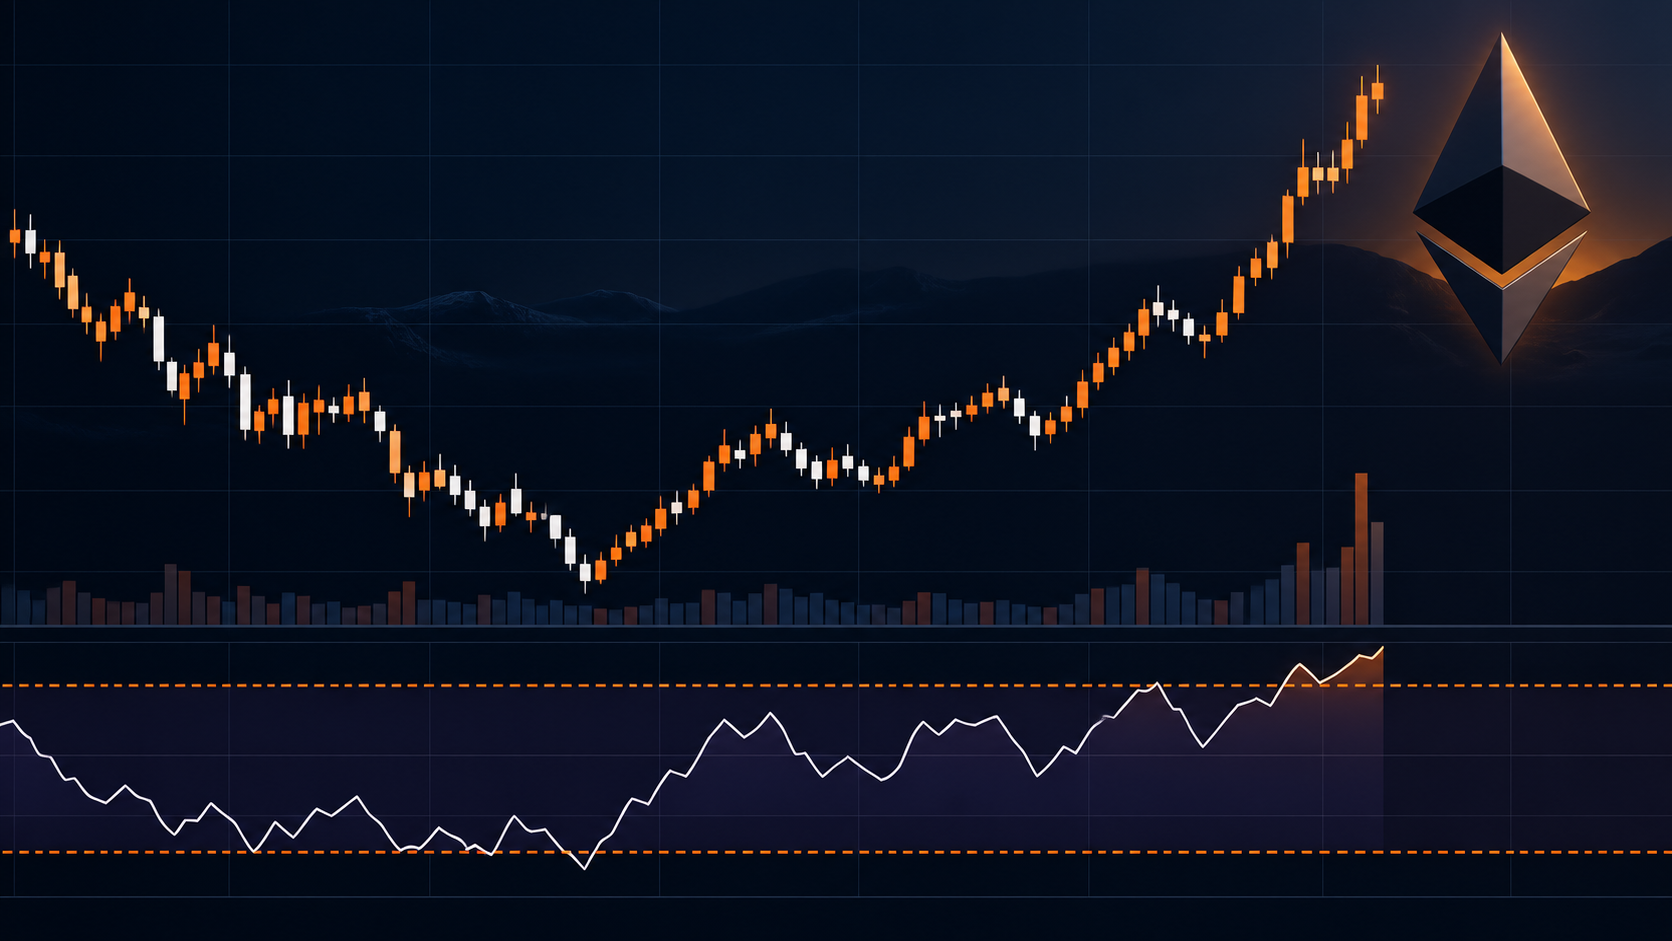
RSI > 70 — Overbought: Price may have risen too quickly in the short term. This points to an increased chance of a pullback or correction, though it doesn't by itself mean a drop is imminent.
RSI < 30 — Oversold: Price may have fallen too quickly in the short term. This increases the likelihood of a bounce, though in a strong downtrend RSI can stay below 30 for extended periods.
RSI ≈ 50: Considered a neutral zone where buying and selling pressure are roughly balanced, offering no clear momentum signal.
What Is RSI Divergence?
One of RSI's strongest signals comes from divergence — when price and the indicator move in opposite directions:
Bullish divergence: Price makes a new low while RSI forms a higher low, suggesting downward momentum is weakening and a reversal may be coming.
Bearish divergence: Price makes a new high while RSI forms a lower high, suggesting upward momentum is weakening and a reversal may be coming.
What to Watch Out for When Using RSI
To be honest: RSI is not a magic indicator that gives you buy/sell decisions on its own. During strong trends, RSI can stay in overbought or oversold territory for a long time — closing a position early just because RSI crossed 70 can lead to losses.
Experienced traders generally use RSI alongside trend structure, support/resistance levels, and volume rather than in isolation. Shorter RSI settings (below 14) generate more signals, but also more false ones.
This content is not investment advice.