



Why Are Countries Buying Gold?
For four years in a row, central banks around the world have been adding gold to their reserves at a remarkable pace. This is not a temporary blip. Even monetary historians describe it as a structural shift. In this article, TraderLex looks at why this is happening, which countries are leading the trend and what it means for gold prices.
Central Bank Buying in Numbers
According to the World Gold Council (WGC), here is the picture:
Central banks have averaged 1,000 tonnes of gold purchases per year for four consecutive years, exactly double the 500-tonne annual average of the decade before 2022.
Net purchases in the first quarter of 2026 came in at 244 tonnes, up 3% year over year and the fastest quarterly pace in over a year.
WGC forecasts roughly 850 tonnes of purchases for the whole of 2026, close to the 863 tonnes recorded in 2025, meaning the momentum has not slowed.
In WGC's 2026 survey, which gathered responses from 76 institutions, 89% of respondents expected global gold reserves to increase over the next 12 months, and a record 45% said their own institution planned to increase its holdings.
Which Countries Are Buying?
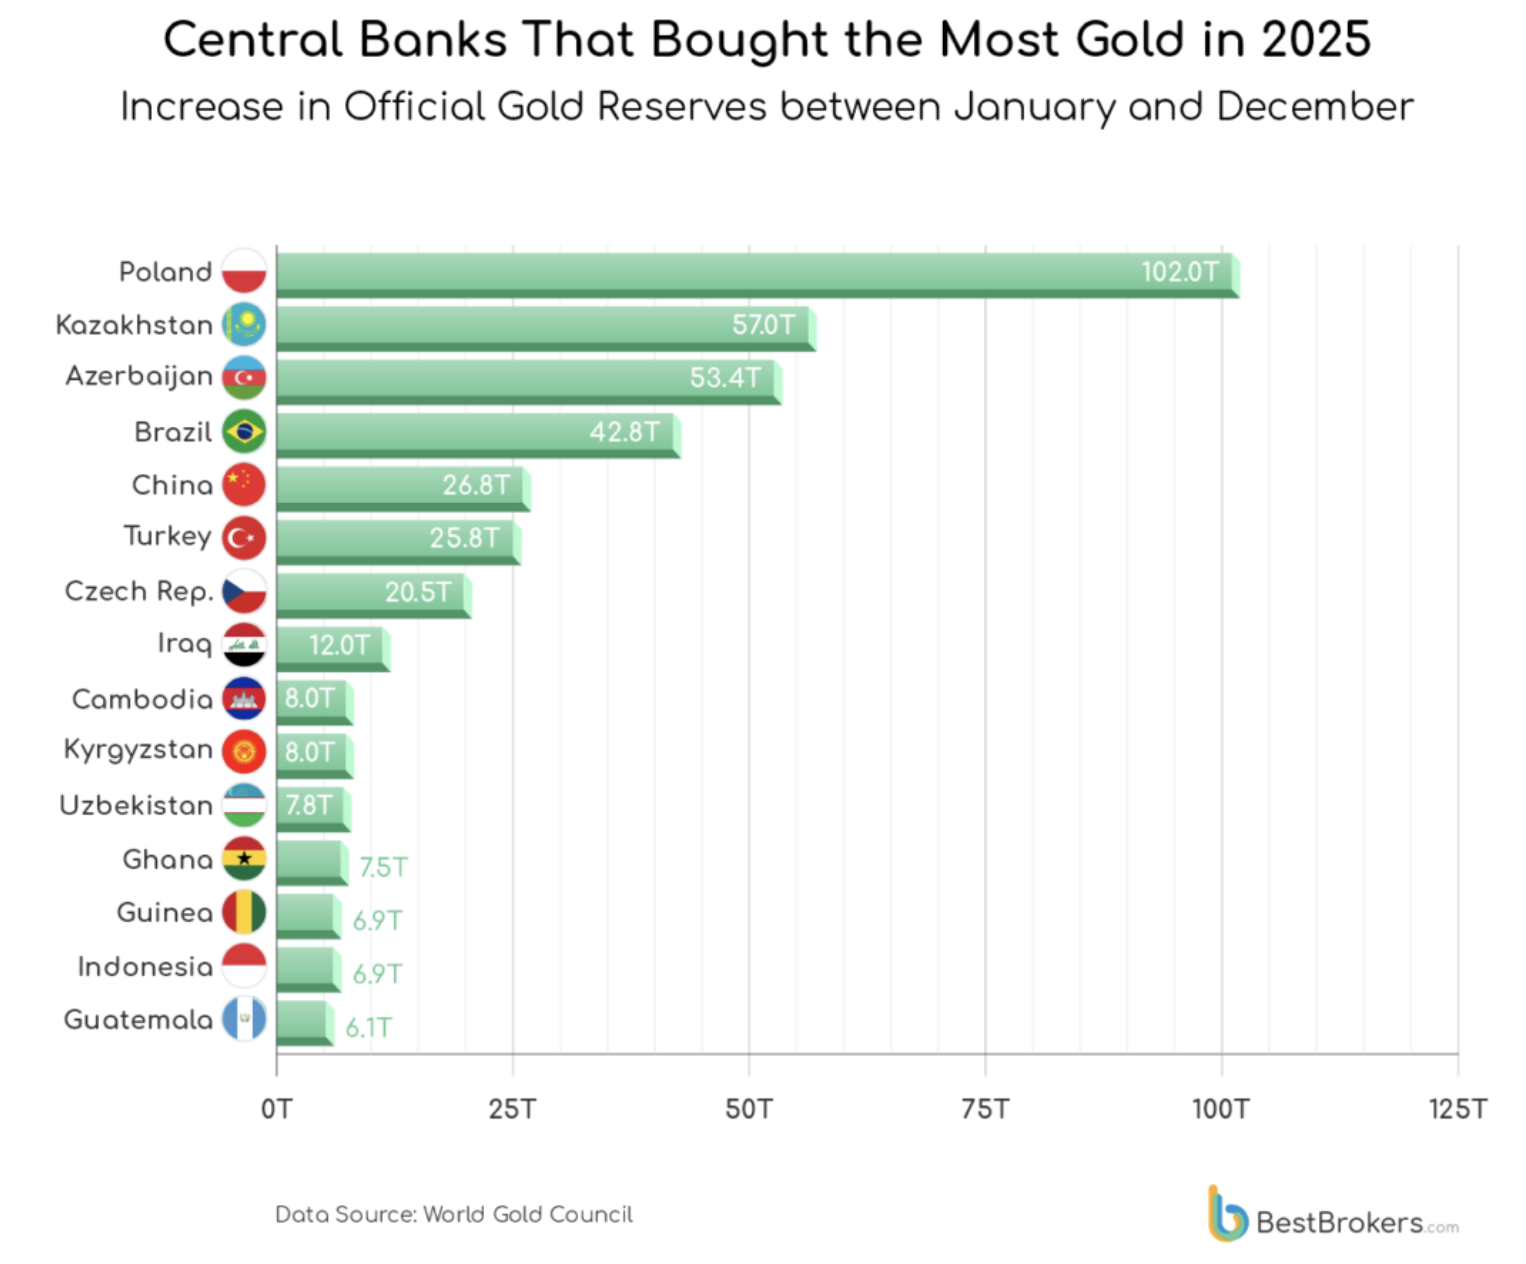
In the first half of 2026, the most active buyers were:
Poland: the clear leader with 82 tonnes, part of a multi-year plan to raise total reserves to 700 tonnes.
Uzbekistan: 41 tonnes.
China: 40 tonnes, extending its ongoing streak of monthly purchases.
Kazakhstan: 27 tonnes.
Czech Republic, Singapore, Chile, Jordan and Ghana were also net buyers during the first half.
One notable detail is how much the buyer list has widened. Countries such as Malaysia, Indonesia, Guatemala and Uganda, which were rarely active in the gold market before, have started buying in recent months. WGC officials describe this as central banks that were absent or inactive for a long time now entering the market.
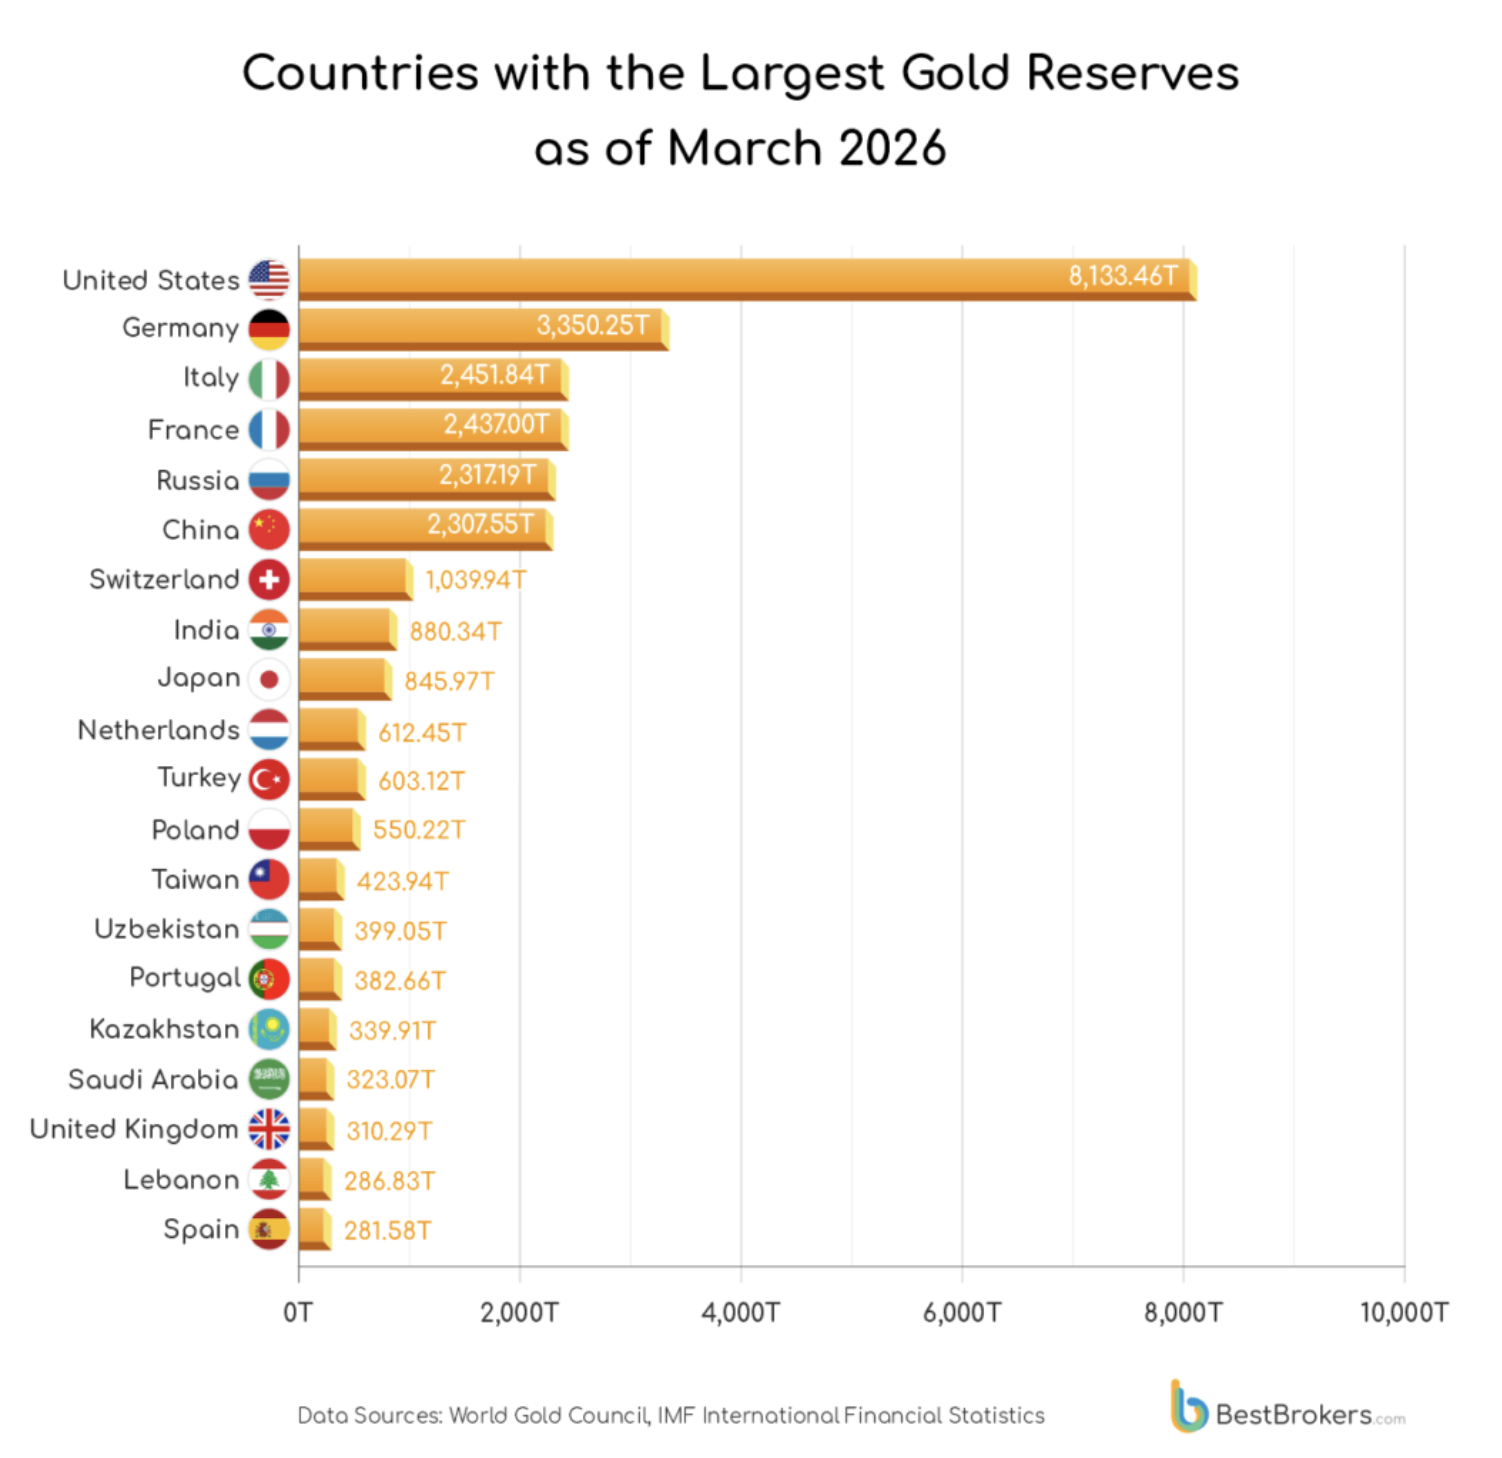
Russia and Turkey, on the other hand, were net sellers during this period. Turkey has sold 83 tonnes year to date, the largest seller, while Russia sold 44 tonnes.
Why Are Central Banks Buying Gold?
According to WGC's survey, three main reasons stand out:
Interest rate volatility (92%): cited by the overwhelming majority as a primary driver.
Gold's performance during crises (90%): gold tends to hold up better than other asset classes during geopolitical and financial stress.
Inflation concerns: widening fiscal deficits and rising public debt are pushing reserve managers toward alternative assets.
A related and frequently discussed factor is de-dollarization: some countries are pursuing a strategy of reducing their reliance on a single reserve currency, the US dollar. Gold stands out in this strategy as a reserve asset that is not subject to any single country's monetary policy or sanctions risk.
How Does This Buying Affect the Gold Price?
Central bank demand is one of the most stable components of gold demand. While retail and fund flows can shift quickly with the news cycle, central banks operate on multi-year strategic plans. This provides a kind of floor of support for the market.
On the price side, 2026 has been an eventful year. Gold hit a record near $5,600 an ounce in January. Afterward, rising Middle East tensions pushed energy prices higher, which revived inflation concerns and reduced expectations for rate cuts, putting pressure on gold. By late September, the price had pulled back to around $4,250, though that level is still roughly 13% higher than a year earlier.
In short, central bank buying does not move the price on its own, but combined with Fed policy, the dollar index and geopolitical risk, it is a key building block shaping gold's medium and long-term direction.
What Does This Mean for Investors?
A practical way to track this trend is to follow WGC's monthly reports and IMF reserve data. A sudden jump in buying volume, or a new country appearing on the list, can be an early signal of shifting institutional risk appetite. That said, this data is not a standalone trading signal. It should be weighed alongside the dollar index, rate expectations and technical levels such as support and resistance, moving averages and Fibonacci retracements.
At TraderLex, we combine macro data with Elliott Wave and Fibonacci analysis across Bitcoin, gold, DXY, oil, forex pairs and US equities. Join our email newsletter and Telegram channel for up-to-date analysis.
Risk warning: This article is for educational purposes only and is not investment advice. Trading financial markets involves the risk of capital loss.